what is mean by statistics?
Statistics is the mathematical science used for collecting, organizing and summarizing the data.
Some terminologies in the statistics
Population: It is a whole dataset.
Sample: It is smaller dataset of the population.
Variable: variable is a property that can take any values.
Quantitative variable: this variable is to represent the numerical data.
Discrete data: data consists of distinct, separate values that can be counted and usually represent whole numbers or integers. for example: students in the classroom.
Continuous data: the data has continuous varies within range. for example: temperature, weight and height.
Qualitative variable: In this data is in the form of categorial or descriptive data. for example: she watched two amines.
Measurements of variables
Nominal: it represents the categorial data without order and values. for example: types of colors, types of fruits.
Ordinal: it represents the data in categorial with order or rank. For example: Rank of students based in marks.
Interval data is numerical data where the intervals between values are consistent, but there is no true zero-point present. For example: Temperature.
Ratio: Ratio data is similar to interval data but includes a true zero-point.
Sampling techniques:
Simple random technique: it ensures that every individual or item of the population has equal chances of being selected for your sample. Example: applying the contest to get a price they select random person.
Stratified sampling technique: This technique involves dividing the population into non-overlapping groups based on certain characteristics. Example: survey about the prices of sarees from female here splitting into two genders male and female.
systematic sampling technique: In this method involves selecting every nth individual from the population. For instance, if you're conducting a survey and you want to select every 5th person from a list.
convenience sampling technique: In this technique picking the who are related to your data. for example: surveying the person who know about politics.
Representation of data
*Bar graph
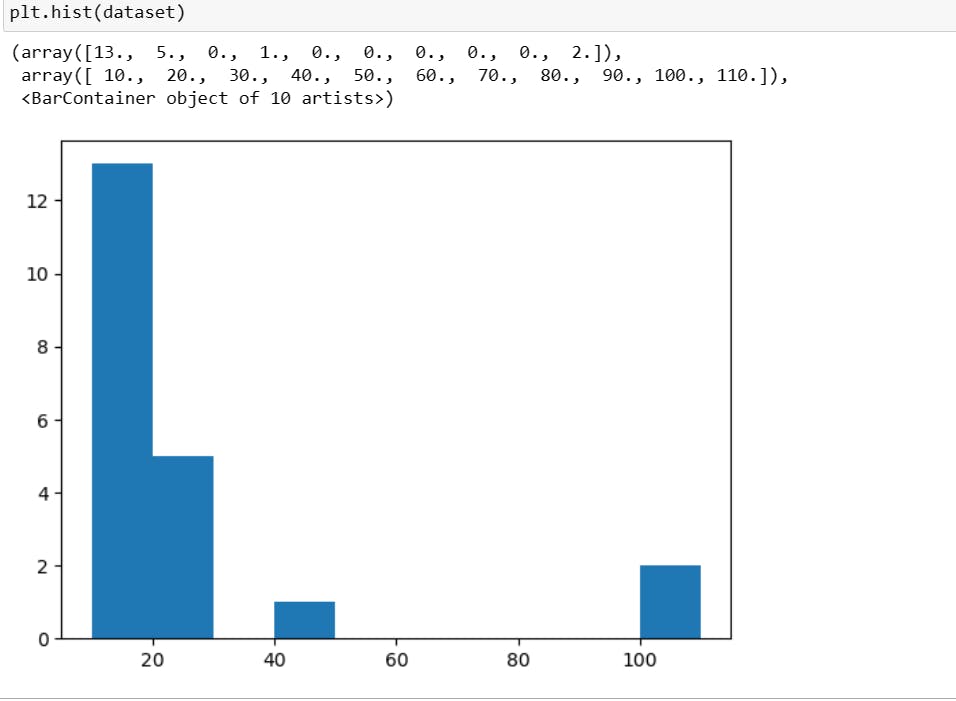
* Histogram
* Pie chart
* Frequency Distribution: It measures the frequency of how many time the element occurs.
Types of statistics
Descriptive Statistics: Descriptive statistics is used for summarizing, interpreting the data and it provides the insights of data.
measure of central tendency: It is used to measure or determines the center of your distribution.it uses mean, median and mode.
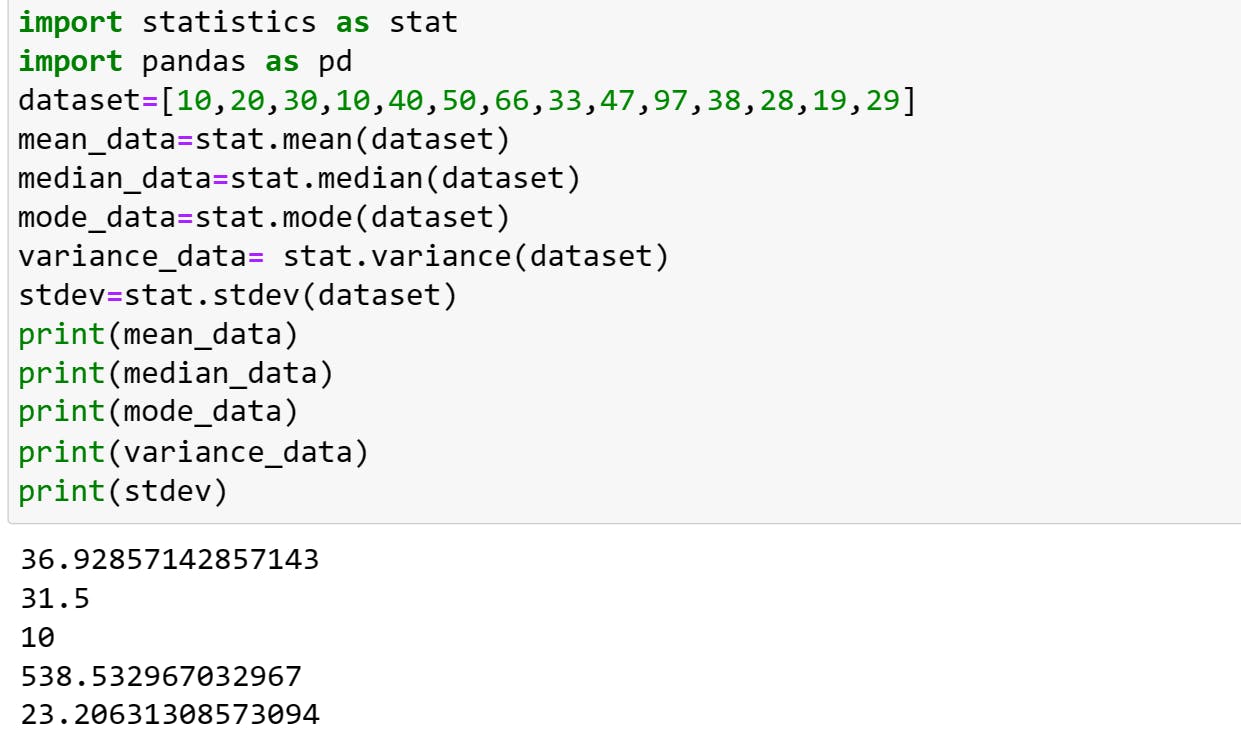
mean: it is the average value of the dataset and it effect by the outlier.
Mean (x̅) = Sum of Values / Number of Values
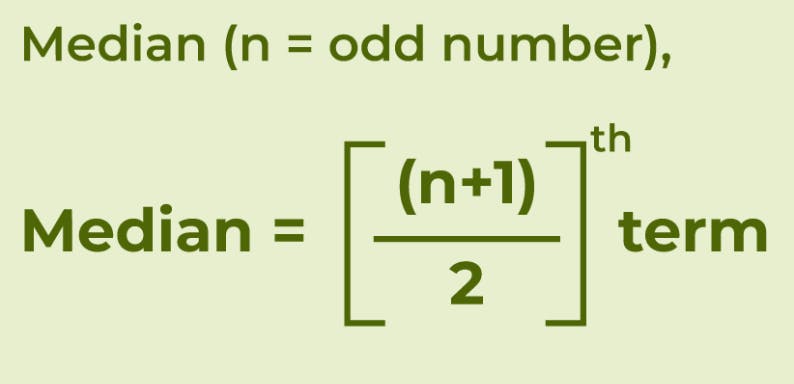
median: It is the middle value in the dataset where the datasets arranged in ascending or descending values. if the dataset has an odd number of values, the median is the middle value. If the dataset has an even number of values, the median is the average of the two middle values.
mode: The mode is the value with the highest frequency of occurrence in the dataset.
measure of dispersion: it describes how data is spread out or distributed around the mean. Common measures of dispersion include variance, standard deviation, and quartiles.
Variance: It quantifies that how much of the data is spread or distributed from the mean.it is denoted by (σ²). population variance is denoted by (σ2,) and sample variance is denoted by (s2).
Variance measures how spread out the data points in a sample (or population) are from the mean. A larger variance indicates more spread, while a smaller variance means the data points are closer to the mean.
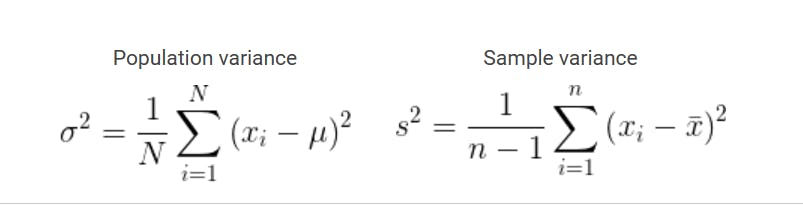
why is sample variance divided by n-1?
Dividing by 'n' underestimates the true variance so to correct the bias we use (n-1) in denominator.
Standard deviation(σ): It is the square root of the variance.it is used to provide a more understandable measure of the dispersion of data from the mean.
Quartiles: It is used to find the outliers from the dataset. Q1 represent the 25th percentile of the dataset and Q3 represent the 75th percentile of the dataset and Interquartile Range(Q).
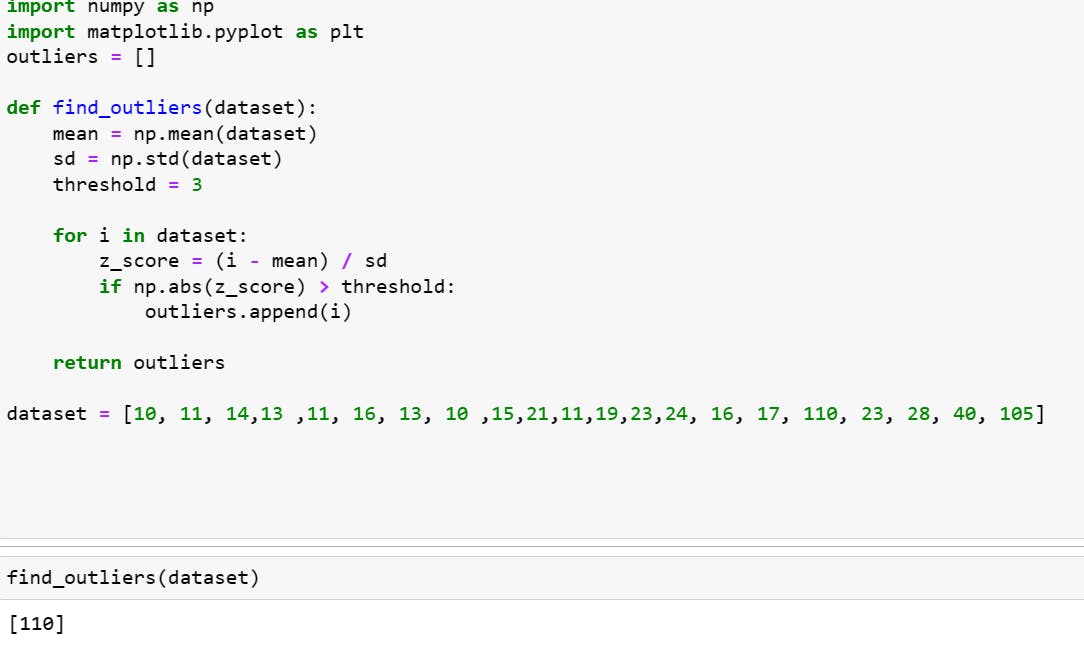
Outliers: It is a data point that significantly differs from other sequential data points in a dataset.
By using Z-score, Boxplot, lower fence and upper fence we can find out the outliers.
Before Going into Z-score lets understand the Gaussian/Normal distribution.
what is distribution?
A distribution in statistics refers to the pattern or arrangement of values or observations in a dataset. It tells us how the values are spread out or distributed across the range of possible values.
Gaussian/Normal distribution: it looks like bell shaped and it is symmetric in nature.
Outcomes:
it has Empirical formula i.e. is 68-95-99.7%, for first standard deviation it spreads out 68%, for second standard deviation 95% and third standard deviation 99.7%.
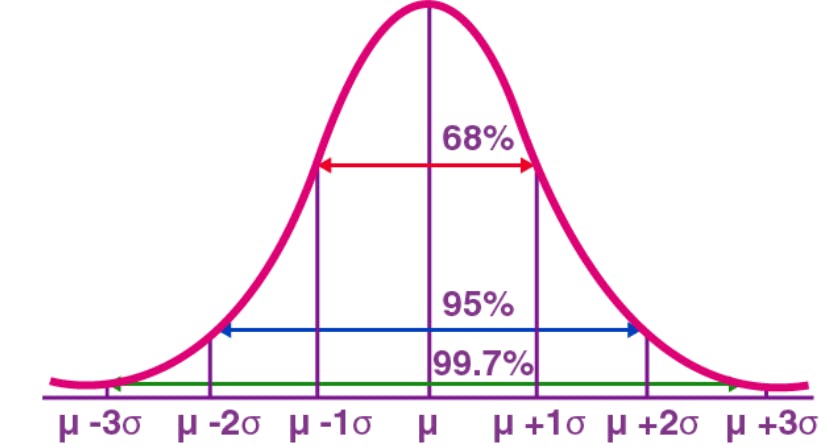
from 3rd standard deviation we can observe the threshold.
Standardization: it is the process of converting the distribution into standard normal distribution (sigma is 1 and mean is 0).
for example: distribution is {1,2,3,4,5,6} and sns is {-3,-2,-1,0,1,2,3}.
Normalization: it tells us the lower bound and upper bound value and minimax scaler is between 0 to 1.
what percentage of scores falls above 5.6?
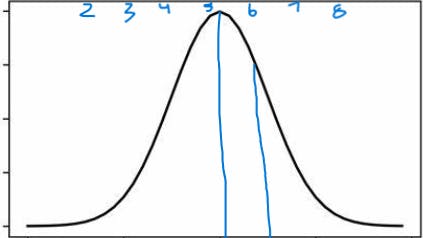
here mean is 5 to find z-score.
z-score =(5.6-5)/1=0.6, to find the area of the tail of the right-side Z Score Table (same as Standard Normal Distribution Table -StatCalculators.com check the z table value i.e. Z table=0.22 =22%
the area of the right side is 1-0.22 =78%
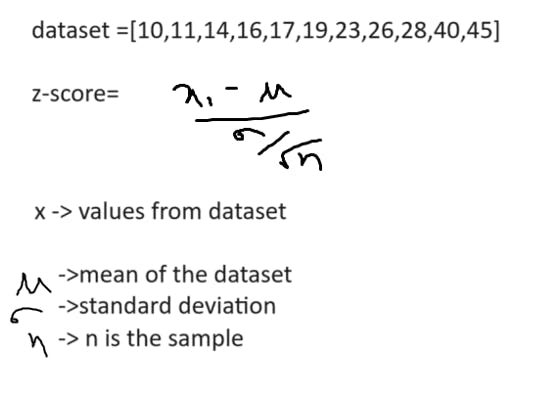
Z-score: It measures how much a data point deviates from the mean in terms of standard deviations.
small correction below remove root n value for z-score
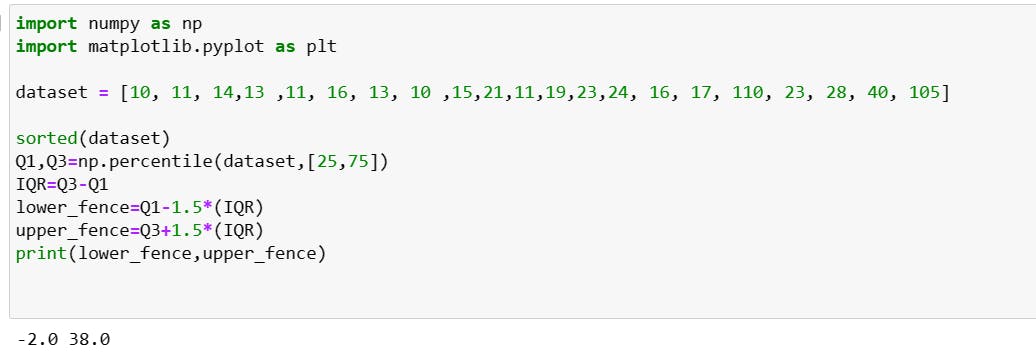
IQR: (in here lower fence and upper fence above values are consider as oultiers)
first, we sort the data.
calculate Q1 and Q3
IQR=(Q3-Q1)
find the lower fence= Q1-1.5(IQR)
find the upper fence=Q3+1.5(IQR)
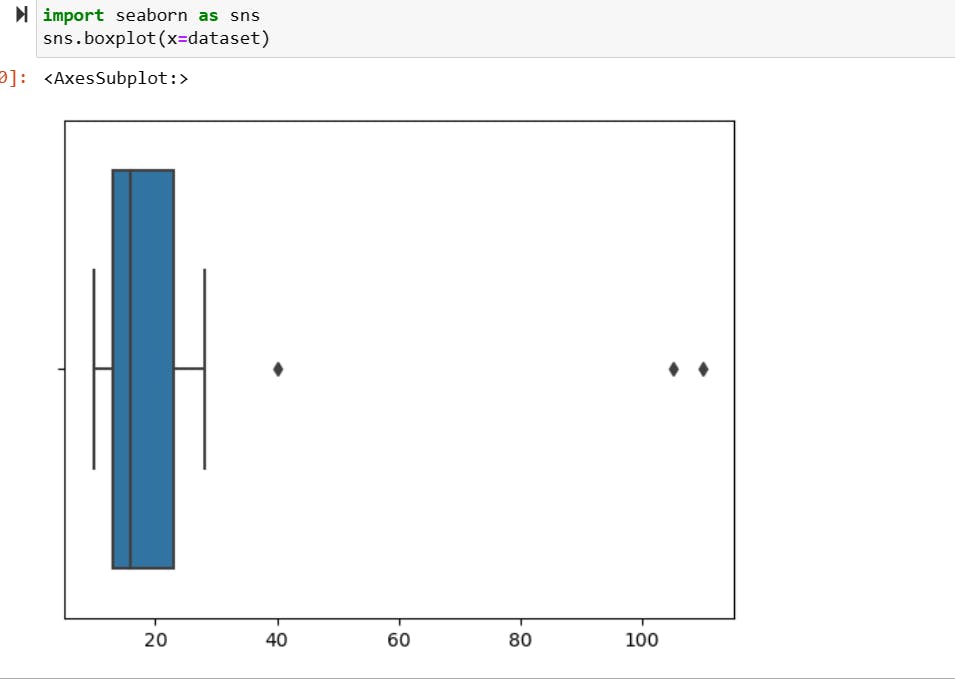
Boxplot: it shows the minimum, maximum and average value of the dataset and detect outliers.
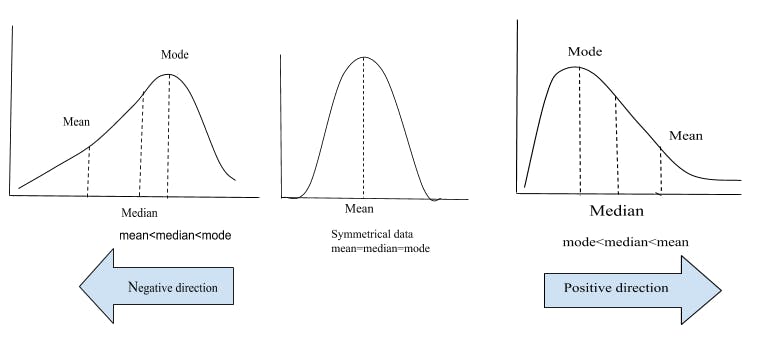
what is Skewness?
A skewed distribution refers to a distribution of data where the values are not evenly distributed around the mean but are instead clustered more heavily on one side of the mean.
positively skewed (right-skewed) distribution, negatively skewed (left-skewed) distribution and it impacts on the outliers may be found on the one side.
what is correlation?
correlation will tell us about the relationship between the data. how they are connected and by the help of correlation we can find the patterns of the two data sets.
some terminologies:
Random variable: if the possible outcomes of one variable does not affect another variable outcome.
Parameters: parameters are the characteristics of the population it tells us the information of the population like mean.
standard error: It tells us how much the sample mean is expected to vary from the true population mean.
Inferential Statistics
- Inferential statistics involves understanding and analyzing patterns and relationships within a sample dataset. When new data is encountered, it identifies these patterns and uses them to predict or infer potential solutions or outcomes.
Hypothesis Testing:
it is used for making conclusions about a population based on sample data by analyzing data.
Null Hypothesis:
It states that there is no significance difference between the variables .it denoted by(H0).
Alternate Hypothesis:
It states that there is a significance difference between the variables.it denoted by(H1).
Type 1 & Type2 errors:
Type 1 error is an error that reject the hypothesis where it has to accept the hypothesis.
Type 2 error is an error that fail to reject the hypothesis where it has to reject the hypothesis.
significance value: this is the value is given by domain expert.
Confidence Interval: is equal to Point estimate +- margin error.
Point Estimate: the value of any statistics that estimates the value of parameter.
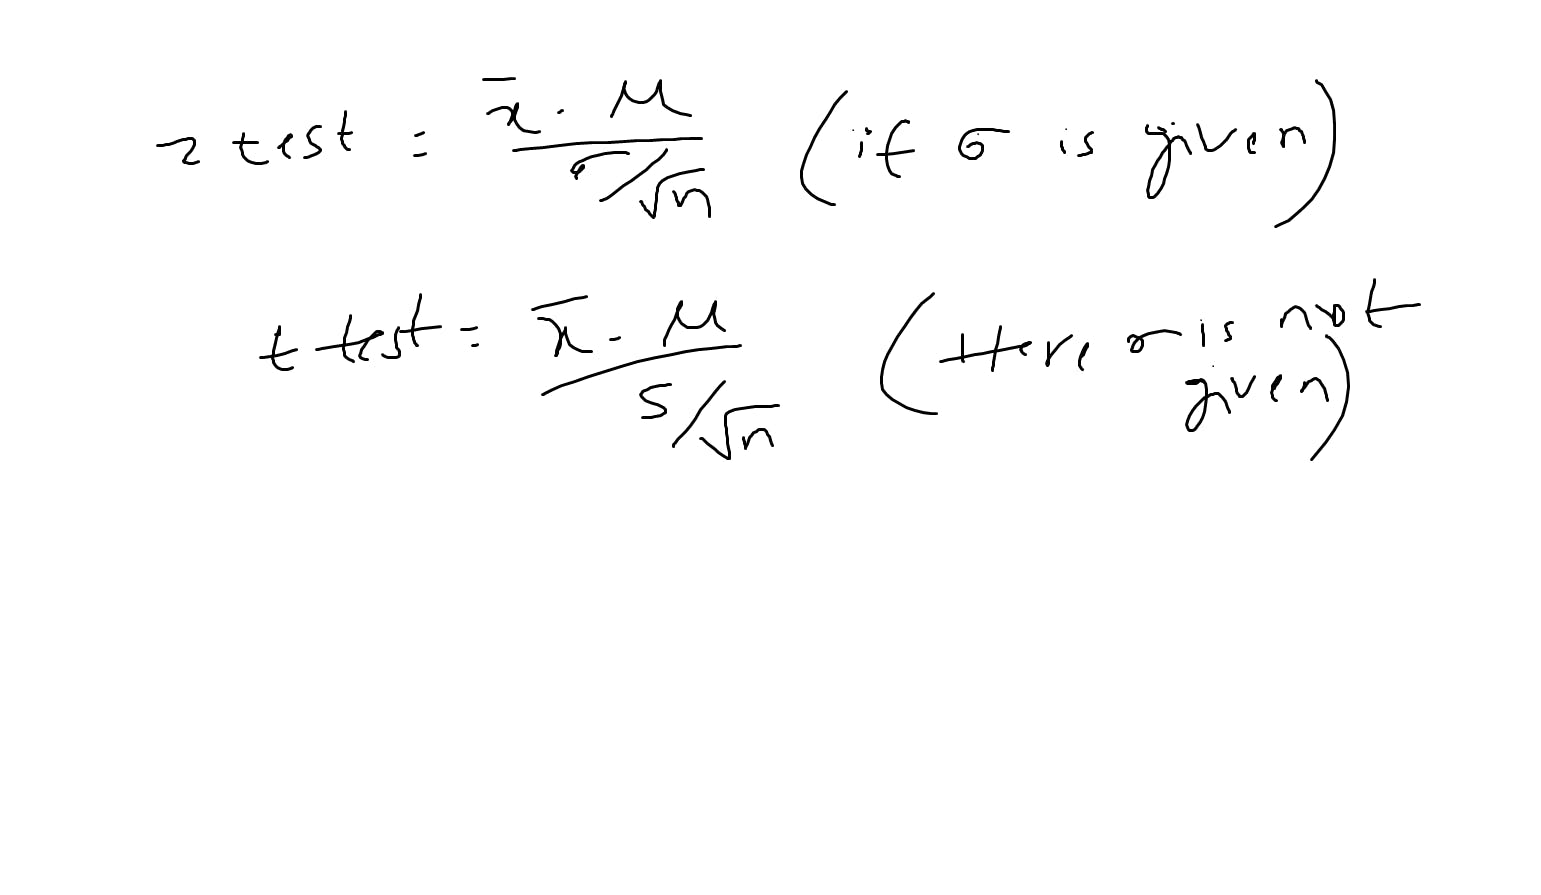
small correction below i mentioned z-test it is z value. same as t value
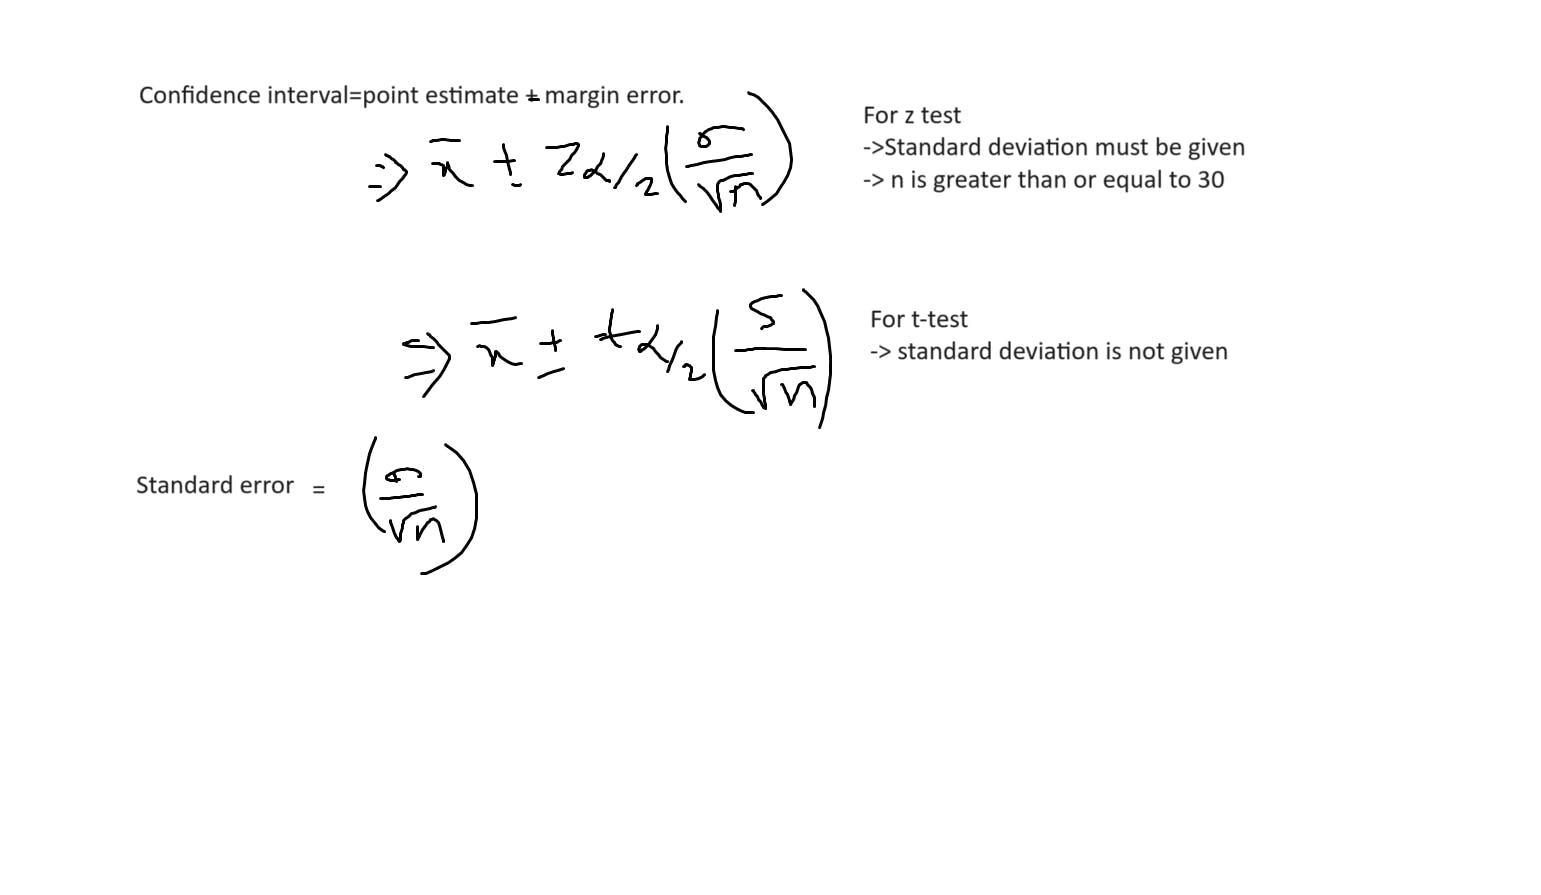
Z & t values you can check out in the table.
P value:
p-value as representing the area under the probability distribution curve for a specific hypothesis test. This area helps you determine the likelihood of observing the test statistic (or a more extreme value) under the null hypothesis.
if p is greater than or equal to significance value the t accepts the null hypothesis otherwise it rejects the null hypothesis.
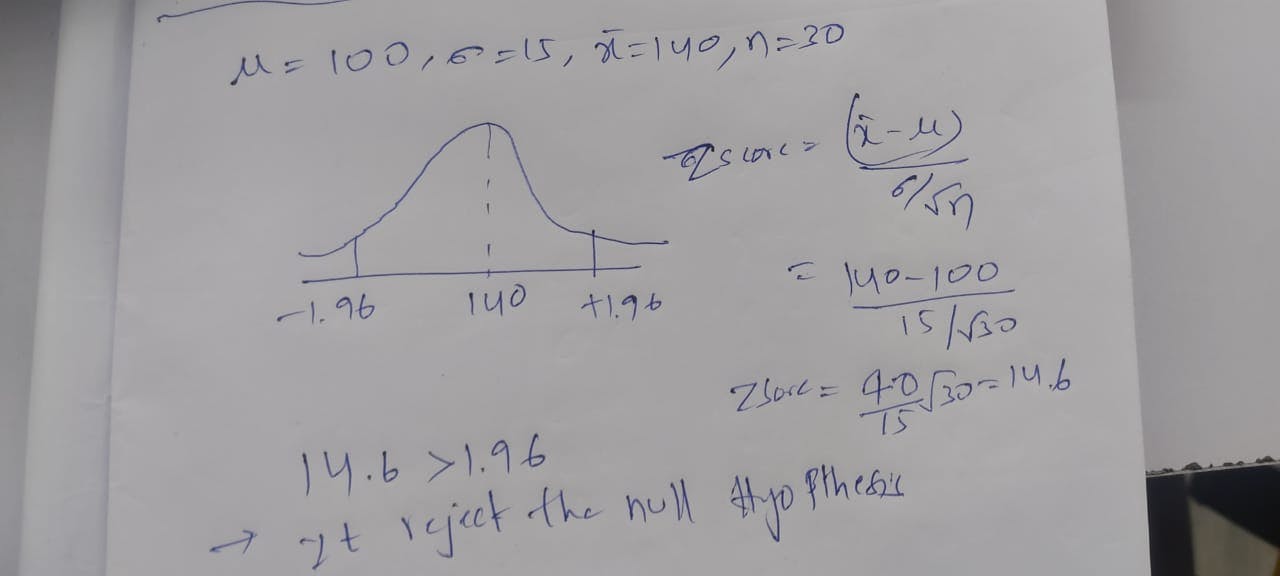
Problems on Hypothesis:
1.In the population, the average IQ is 100 with a standard deviation of 15. A team of Scientist want to test new medication to see if it has either a positive or negative effect on intelligence, or not effect at all. A sample of 30 participants who have taken the medication has a mean of 140. Did the medication affect intelligence?
2 A professor wants to know if her introductory statistics class has a good grasp of basic math. Six students are chosen at random from the class and given a math proficiency test. The professor wants the class to be able to score above 70 on the test. The six students get the following scores:62, 92, 75, 68, 83, 95.
Can the professor have 90% confidence that the mean score for the class on the test would be above 70.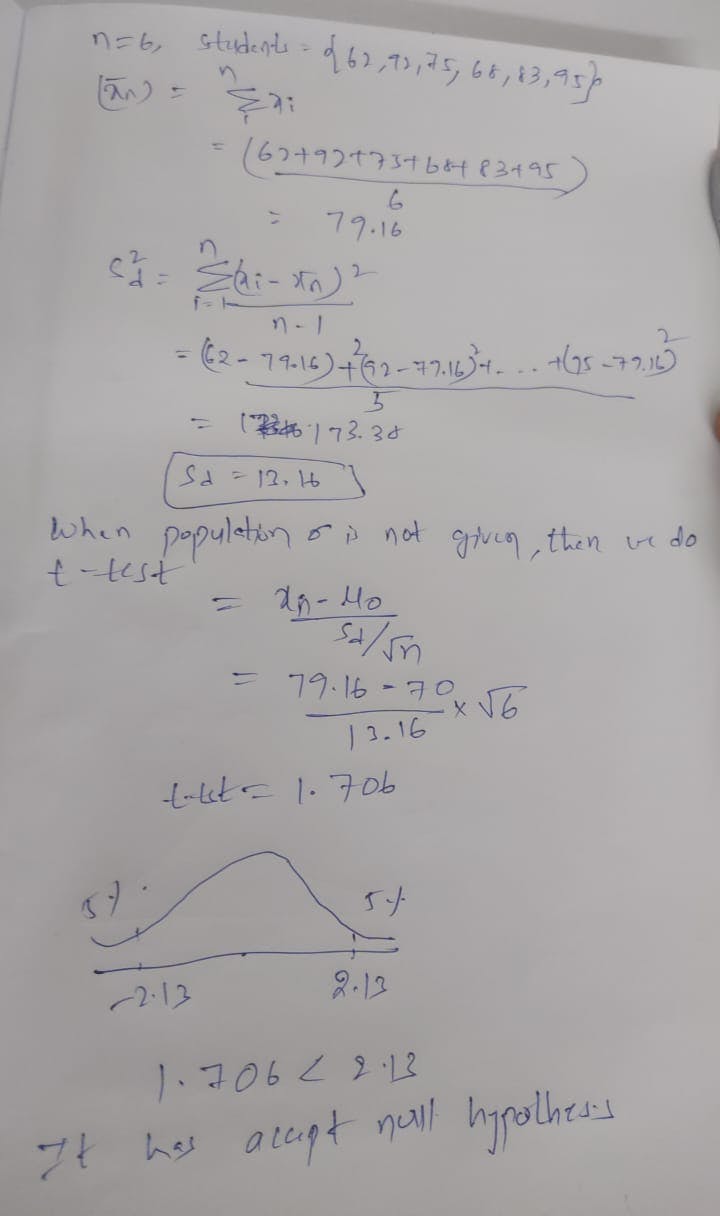
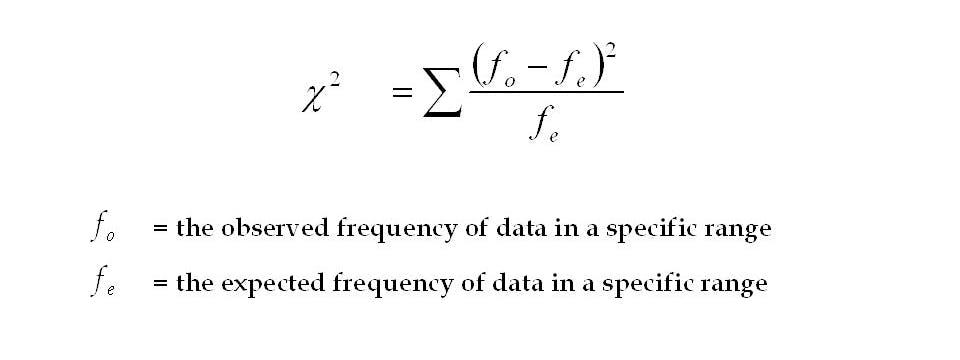
Chi-Square test:
It claims about the population proportions, and it is a non-parametric test that performed on categorial (nominal & ordinal). here we can conclude the hypothesis testing by finding the chi-square value if it is greater than critical value the we can reject if not accept the null hypothesis testing.
To find the degree of freedom = (r - 1) * (c - 1).
based on the df and the significance value we can find the critical value by checking in the chi-square table.
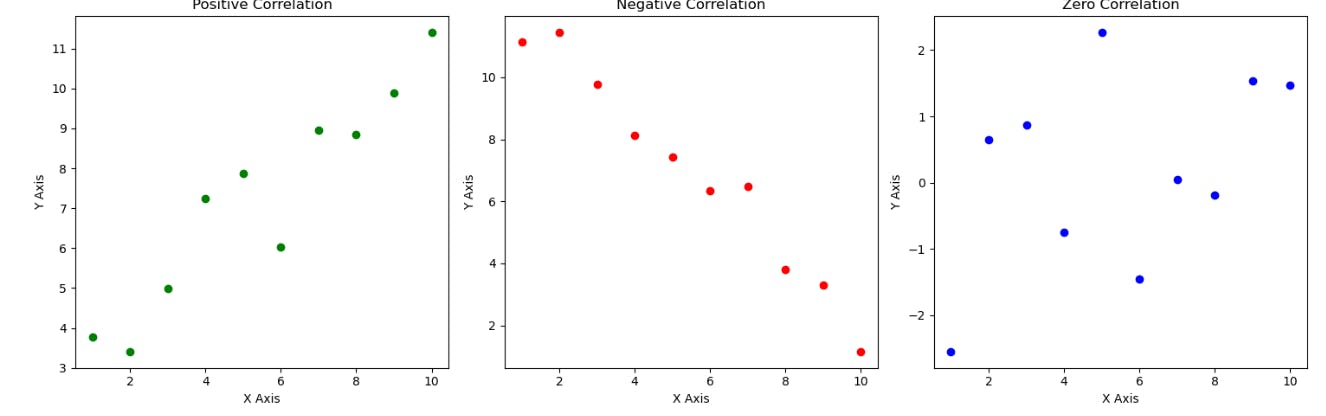
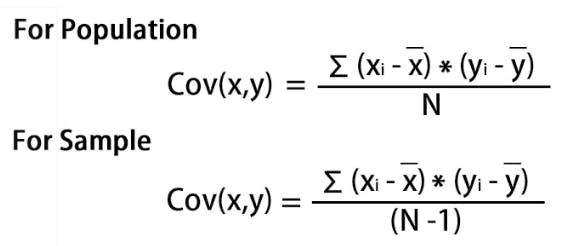
Covariance:
Covariance reveals the linear relationship between two variables and how they depend on each other. A positive covariance indicates that both variables tend to increase or decrease together, while a negative covariance suggests that when one variable increases, the other decreases.
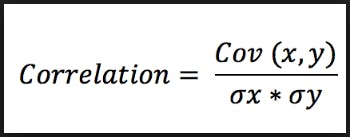
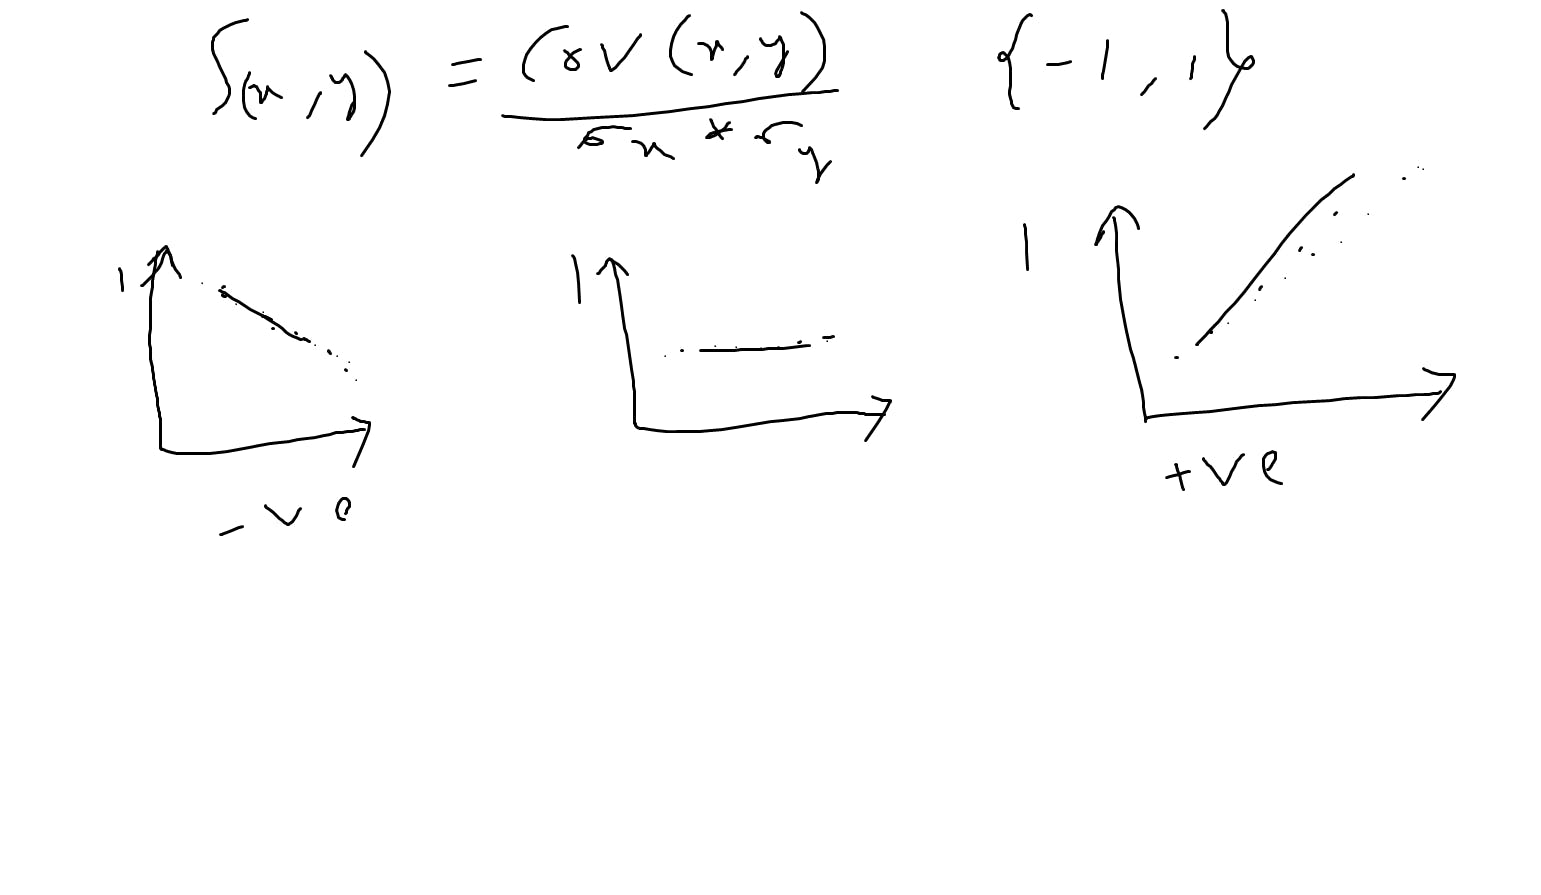
Correlation, like covariance, also describes the relationship between two variables, but it goes further by quantifying the strength of that relationship on a scale from -1 to 1. A correlation value closer to +1 indicates a strong positive relationship, while a value closer to -1 indicates a strong negative relationship. Values close to 0 suggest a weak or no linear relationship between the variables.
Pearson correlation coefficient:
It's well-suited for measuring the strength and direction of a linear relationship between two continuous variables.
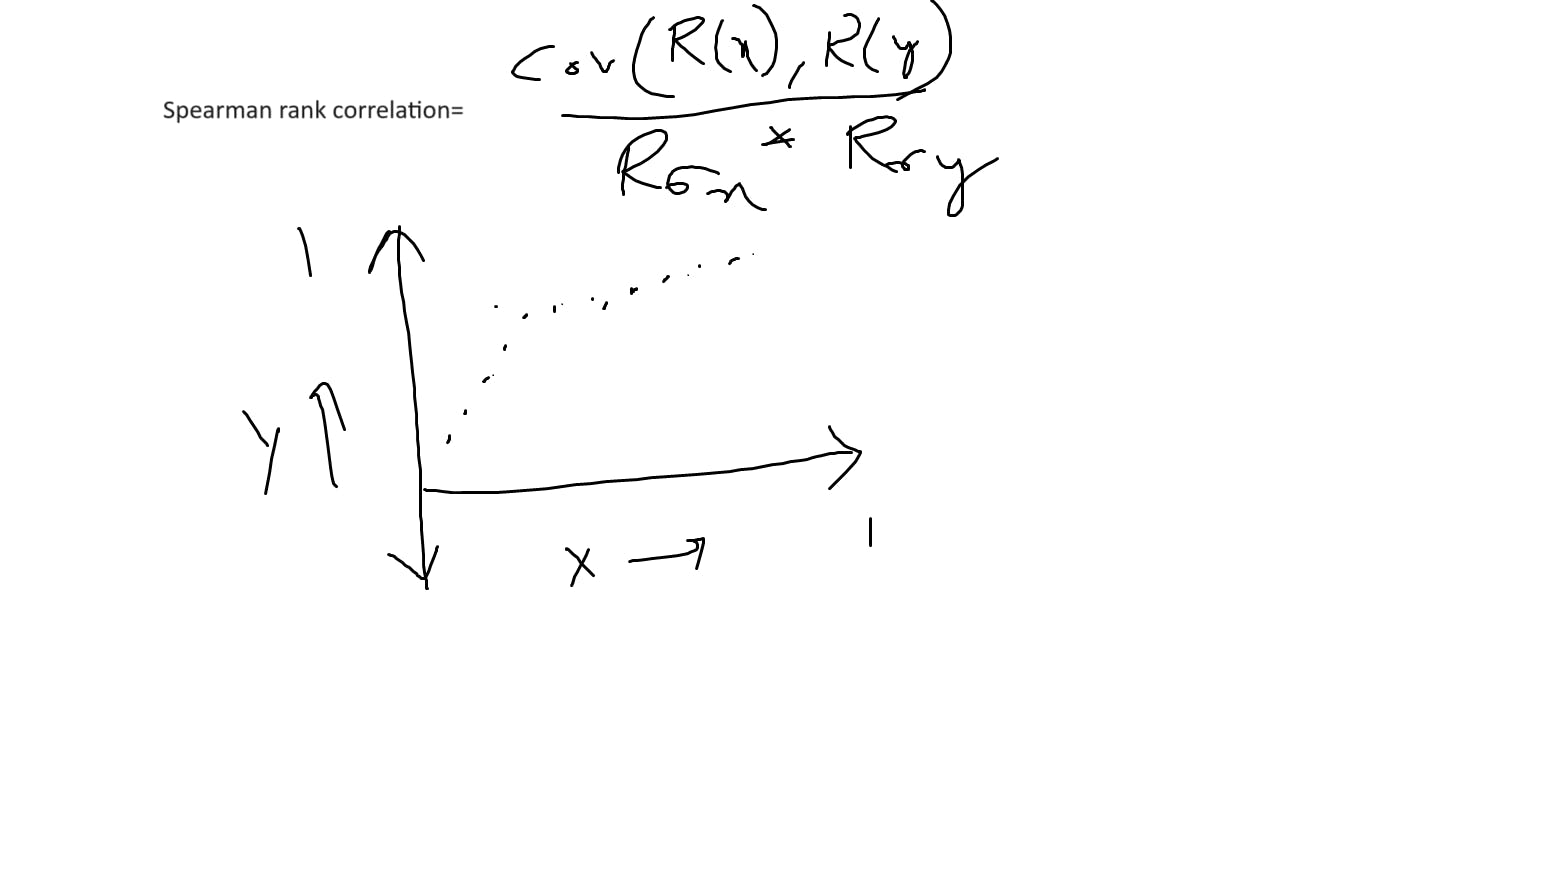
Spearman's rank correlation:
it is particularly effective in assessing non-linear relationships between variables. It does this by using the ranks of the data rather than the actual values. it useful when dealing with ordinal or ranked data sets.
probability:
probability is states that measuring or estimating the likelihood of an event occurring.
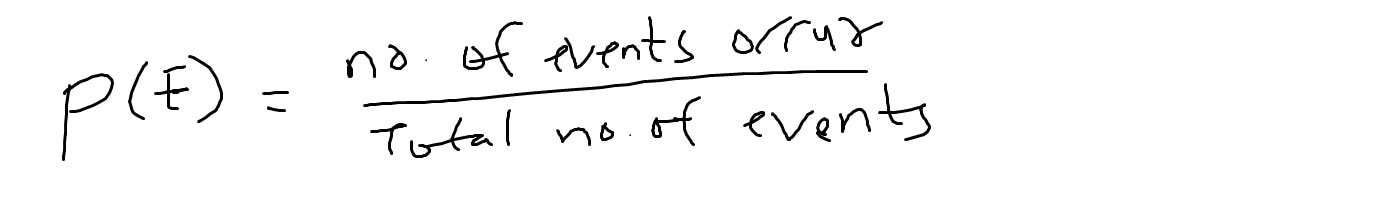
for example: flipping a coin chance of getting the head and tail.
Additional rule-> P(A∪B) =P(A)+P(B)−P(A∩B);
multiplication rule->P(A∩B)=P(A)×P(B)
- MutualExclusiveEvents:
If two events they can't occur at same time, then it known as mutual exclusive events for example flipping a coin it may be head or tails.
- Non-MutualExclusiveEvents:
multiple events can occur at same time then it is known as non-mutual exclusive events. for example, events is drawing a red heart from a standard deck of cards.
- Dependent Event:
if one variable is depending on the other variable for example in a box we have 5 apples in that 3 are red apples and 2 are green apple if we pick the one red apple it changes the outcomes of another red apple.
- IndependentEvent:
if one variable is doesn't depends on the other variable for example in a box, we have 5 balls which all are indifferent color.
Conditional Probability:
Conditional probability is a concept in probability theory that deals with the likelihood of an event occurring given that another event has already occurred or is known to have occurred.
Let's say we have a bag with red and blue marbles. If we pick a marble at random:
P(A∣B) =P(A∩B)/P(B).
Event 𝐴 is picking a red marble.
Event 𝐵is picking a blue marble.
𝑃(𝐴∣𝐵) would be the probability of picking a red marble given that we know we picked a blue marble first.
Naive Bayes Theorem:
permutations and combinations:
Permutations refer to the number of ways we can arrange items.
n P r = n! / (n - r)!
combinations refer to number of ways we can select the items or we can define as subsets of an items.
n C r = n! / (r! × (n - r)!)
Central Limit theorem:
The Central Limit Theorem (CLT) is a fundamental concept in statistics that states that regardless of the shape or type of the original population distribution (whether normal, lognormal, or any other distribution), when you repeatedly take random samples from that population and calculate the means of these samples, the distribution of these sample means will tend to follow a normal distribution as the sample size increases.
uses cases of these central limit theorem
Estimation of Population Parameters
Hypothesis Testing
Types of Distributions
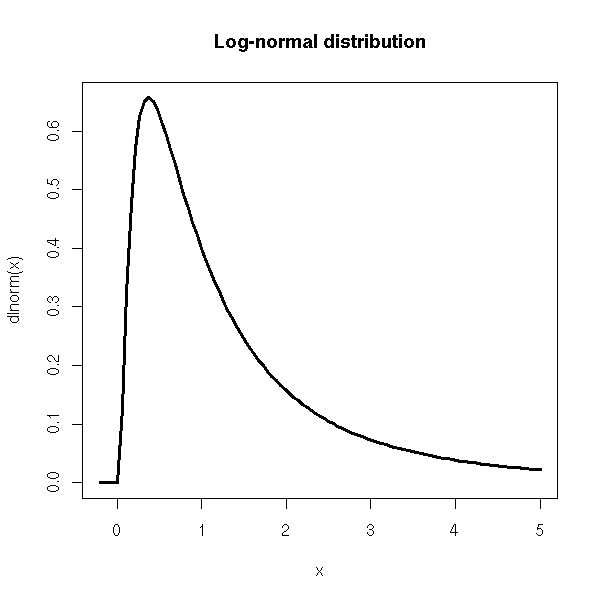
Log-NormalDistribution:
the log-normal distribution is useful when dealing with data that has a skewed. we use log to convert values into logarithmic, so it represents in normal distribution.
Example: weight, stock prices, comments with large.
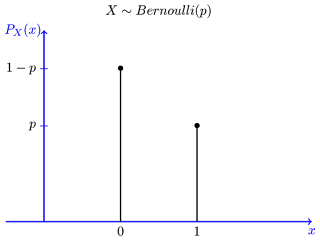
Bernoulli'sDistribution:
. It models a single trial or experiment that has two possible outcomes: success (often represented as 1) or failure (often represented as 0). These outcomes must be mutually exclusive, meaning only one of them can happen in a single trial.
for example: Fairness of a coin it may be head or tail.
Probability Mass Function
the PMF for Bernoulli's distribution provides a mathematical calculation and the probability of each possible outcome in a single trial. It's expressed as
𝑃(𝑋=𝑥) = {𝑝, if 𝑥=1 (success)
1−𝑝, if 𝑥=0 (failure)
}
By incorporating the PMF into Bernoulli's distribution, we gain insights into the likelihood of specific outcomes in binary events, facilitating precise probability calculations for success or failure scenarios.
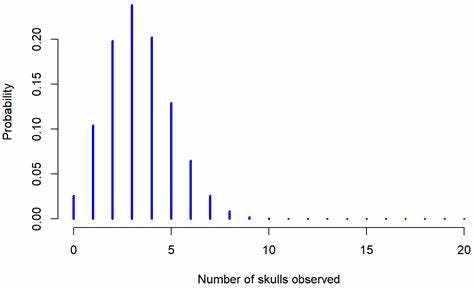
BinomialDistribution:
The Binomial Distribution is a probability distribution used to model the number of successes in a fixed number of independent trials, where each trial has the same probability of success.
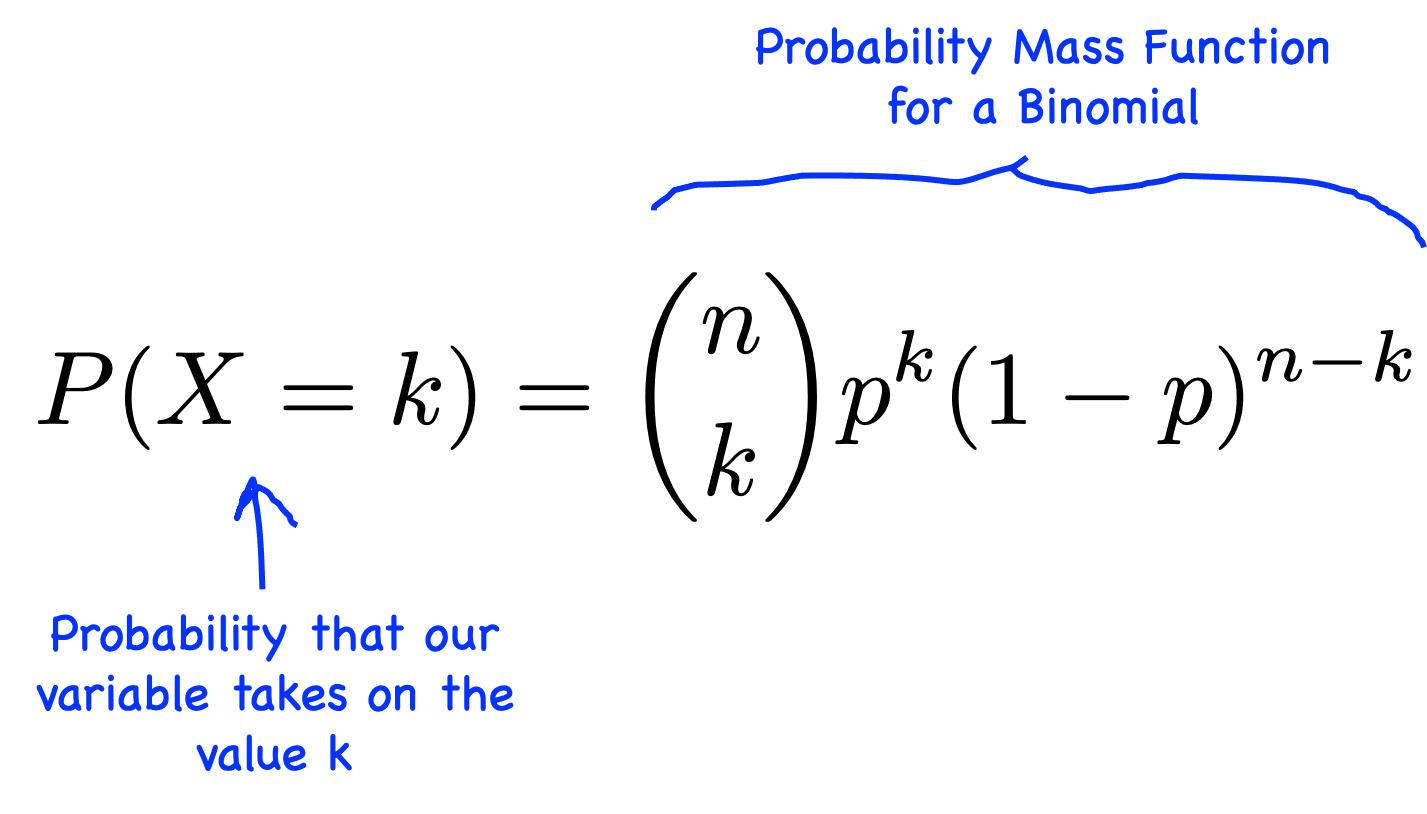
Probability Mass Function (PMF): The Binomial PMF calculates the probability of getting a specific number of successes (heads in this case) in a fixed number of trials. It's given by the formula:
Here,
X is the random variable representing the number of successes,
k is the specific number of successes you're interested in,
𝑛 is the total number of trials (coin flips in our example),
𝑝 is the probability of success on each trial (probability of getting heads in a flip),
(1−𝑝) is the probability of failure on each trial (probability of getting tails).
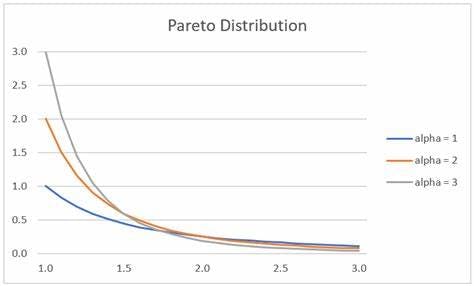
Pareto'sDistribution
Pareto's distribution specifically refers to the unequal distribution of wealth or resources.it follows the 80-20% rule where the 80% of a heavy tail where a 20% of small number of elements contribute significantly to the overall distribution.
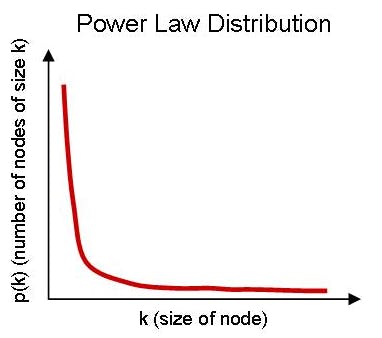
PowerlawDistribution
It describes relationships where one quantity varies as a power of another. It's characterized by a long tail, indicating that a small number of occurrences have a very high frequency.