

NumPy
NumPy is indeed a core library for scientific and numerical computing in Python, and it is widely used for working with arrays and providing various mathematical solutions. NumPy arrays are multidimensional array objects that allow efficient computation and manipulation of data.
In python Arrays are faster in retrieval than List because Arrays are continuous memory allocation, and it uses low memory.
import numpy as np #To impor tthe numpy module
print(np.__version__)#To check the version of numpy
arr=np.array([1,2,3]) #To create an 1d-array
print(arr) #To print an array here you can observe in array we don't have comma unlike in list
type(arr) #To check the type
arr=np.array([[1,2],[3,4]]) # To create an 2d array
arr=np.array([[[1,2],[3,4]],[[1,4],[1,5]]]) # To create an 3d array
np.zeros(2) #To create an id array with all zeros
np.zeros([2,3])#To create an 2d array with rows and columns value zero
np.zeros([2,3,3])#To create an 3d array with rows and columns value zero
np.ones(2) #To create an id array with all ones
np.ones([2,3])#To create an 2d array with rows and columns value ones
np.ones([2,3,3])#To create an 3d array with rows and columns value ones
np.full([2,2],9)# To create an 2d array with r & c with specific value
np.random.randn() #To generate random value
np.random.randn(2,3) #To generate random value in r & c's
np.random.randint(10) # To generate random int  values less than given number
np.eye(3,3) # for diagonal elements
arr=np.arange(10,21,2,dtype=float) #TO get sequence order and btwn 10 and 20 and 2 is denotes differs numbers and dtype is optional
np.reshape(arr,[2,3]) #to reshape the array
np.linspace(0,10,2,endpoint=True,dtype=int)#it divides into the 2 intervals (in between 0 ,10)
#sample o/p=[0. , 10.] if w euse fals eit not cconsider last value
arr=np.arange(1,11,1)
arr.reshape(2,5)
np.size(arr)
arr.dtype
#Slicing
a=np.arange(1,10)
a[:] #To get all the values
a[1:] #it starts from 1  to last index
a[:4]# it starts from 0 index to 4 index
a[2:7]#get all the values between 2 and 7
a[:: -1]#To print revers order
a[ :: -2]#To print reverse order differ by 2
b=np.copy(a)#To copy array
c=b.view()#View means it gives the same reference
a=np.array([3,5,4,2,47,1])
np.sort(a,axis=1) #To sort the array and axis is option for 1 d array
# axis -0 is for row s and axis-1 is for colums by default we have axis 0
np.append(a,20)#To append the element in array
np.insert(a,0,10) #To  insert the element based on index
np.delete(a,index)#To delete element based on index
np.concatenate((a,b))
Matplotlib
Matplotlib is one of the libraries in python it is used of DataVisualization.
DataVisualization
it is the presentation of data in the form of pictorial or graphical format and to understand Insights of data.
Types of matplotlib
Bar graph
Histograms
scatterplots
pie plot.
Hexagonal Bin plot
Area plot
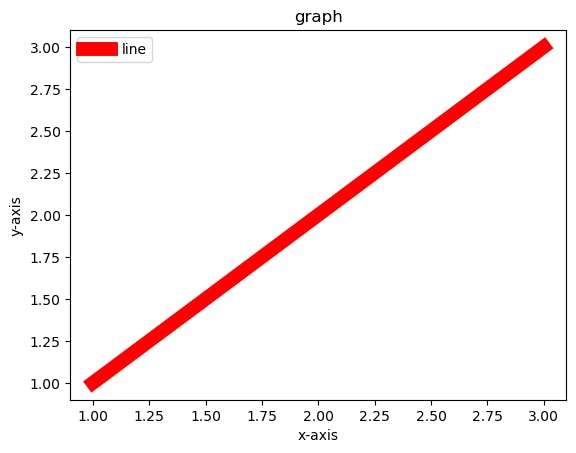
Sample graph.
from matplotlib import pyplot as plt
plt.plot([1,2,3],[1,2,3],c='red',linewidth=10,label="line")
plt.xlabel("x-axis")
plt.ylabel("y-axis")
plt.legend()
plt.title("graph")
plt.show()
BAR GRAPH
from matplotlib import pyplot as plt
plt.bar([1,4,6],[1,2,3],label='bar',color='g')
plt.bar([2,3,5],[4,5,6],label='bar',color='b')
plt.xlabel("x-axis" )
plt.ylabel("y-axis")
plt.legend()
plt.title("graph")
plt.show()

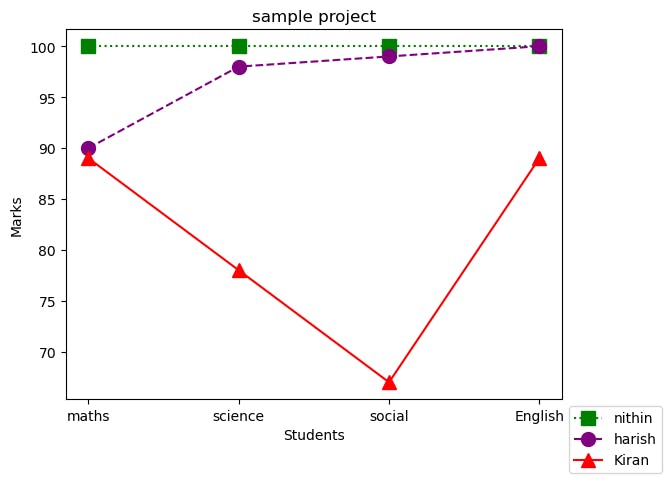
Example: How to represent and some operation on the graph
import numpy as np
#Subjects
subjects=["maths","science","social","English"]
#Students
students=["nithin","harish","Kiran","Suuny"]
#marks
nithin=[100,100,100,100]
harish=[90,98,99,100]
Kiran=[89,78,67,89]
sunny=[89,78,67,57]
marks=np.reshape([nithin,harish,Kiran,sunny],(4,4))
plt.plot(marks[0],c='green' ,marker='s',ms=10,ls=':',label=students[0])
plt.plot(marks[1],c='purple' ,marker='o',ms=10,ls='--',label=students[1])
plt.plot(marks[2],c='Red' ,marker='^',ms=10,ls='-',label=students[2])
plt.title("sample project")
plt.xticks(list(range(0,4)),subjects)
plt.legend(loc='upper left',bbox_to_anchor=(1,0))
plt.xlabel("Students")
plt.ylabel("Marks")
plt.show()
Pandas:
Pandas is a popular Python library used for data manipulation and analysis, and one of its key features is the ability to work with tabular data through its Data Frame object.
import pandas as pd
print(pd.__version__)#Version
#formation of dataframe
s=pd.read_excel(r'C:\Users\sai4c\OneDrive\Desktop\personal\New Microsoft Excel Worksheet.xlsx')
s.shape # to find the r & c
s.columns #(get all colums attributes)
s.head() #default it gets 5 ouputs
s.head(3) # we can customize
s.tail() # from late we get by default 5  rows
s.tail(3)#WE can customize
s.info() #it gives us the information of coulums and  how many non numm values and datatype
s.describe().transpose() # get information  and it trabspose
#slicing
s[:]
s[1:]
s[ : 6]
s[ :: -1]
s.sort_values('salaray',ascending=False)#to sort the column.
s.salaray>1000 #It will check row  by row fro each row we get bool value
s.duplicated() #it will tells duplicates row check by row and return bool
s["age"]=[1,2,3,4,5,6,7,8] #To addd column
s.drop(columns="age") #Yo drop the colums
s.drop("age",axis=0) #drops the row
s.
s.loc[s["salaray"]>10000] #to filter the table
s[["Country","age"]] #To get the sepcified columms
s[1:4][["Country","age"]] #To get the sepcified columms with specified rows
s.salaray*s.age #mathematical operations

Seaborn:
It is for advance DataVisualization.
Outlier: It is a datapoint that differs significantly from other observations. Outlier is may due to variability in measurements or it indicates any experimental error
#from above pandans continue thats data
import seaborn as sns
import matplotlib.pyplot as plt
sns.displot(s["Country"] )#It is one variable we call as univariable analysis
plt.title('Distribution of Age')
plt.xlabel('Age')
plt.ylabel('Density')
plt.show()
sns.boxplot(data=s,x='Country' ,y='age')#It has two varibales it is calleed bivariable analysis